Profiling ICU4C with callgrind
Contents
Prerequisites
Valgrind, callgrind and kcachegrind together proved performance profiling of C++ code, including annotated source code with time consumption at each line.
Prequisites:
- Linux with the clang compiler.
- Valgrind. If not already installed, from the command line,
sudo apt install valgrind
- kcachegrind. To install:
sudo apt install kcachegrind
Build ICU. An optimized build with debug symbols is generally best for profiling:
cd icu4c/source
./runConfigureICU --enable-debug Linux
make -j6 check
Run test code
Prepare the test code you wish to measure. Valgrind is very slow, so be wary of long running tests. Because Valgrind tracks every last machine instruction (it’s not a sampling profiler), getting good results does not require a long run.
Run the test code under valgrind with callgrind. The example below runs a test from intltest, but that is not a requirement; valgrind will profile any executable. The differences from a normal (non-profile) invocation are highlighted.
Without the LD_BIND_NOW=y the output is polluted by symbol lookups.
LD_LIBRARY_PATH=../../lib:../../stubdata:../../tools/ctestfw:$LD_LIBRARY_PATH
LD_BIND_NOW=y valgrind --tool=callgrind
--callgrind-out-file=callgrind.out ./intltest
translit/TransliteratorTest/TestAllCodepoints
The raw profiling data will be left in a callgrind.out file,
ls -l callgrind*
-rw------- 1 aheninger eng 325779 Oct 3 15:51 callgrind.out
View in kcachegrind
Run kcachegrind to view the results.
kcachegrind callgrind.out
Explore. Lots of interesting data is available.
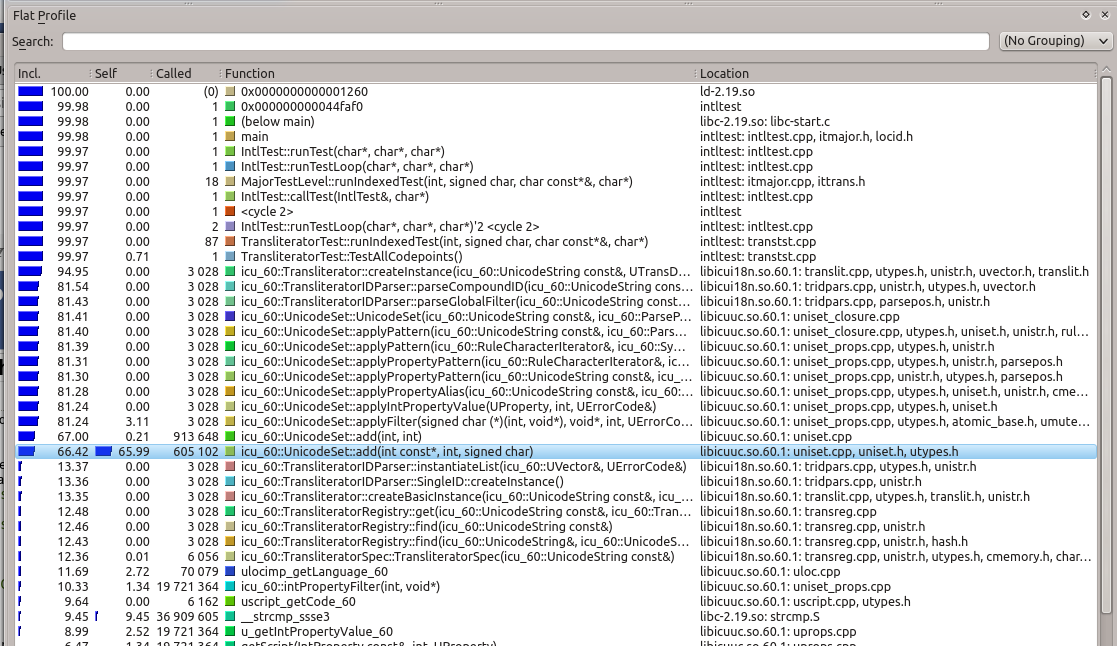
For the above run, here are the top functions, ordered by cumulative time (including calls out) spent in each.
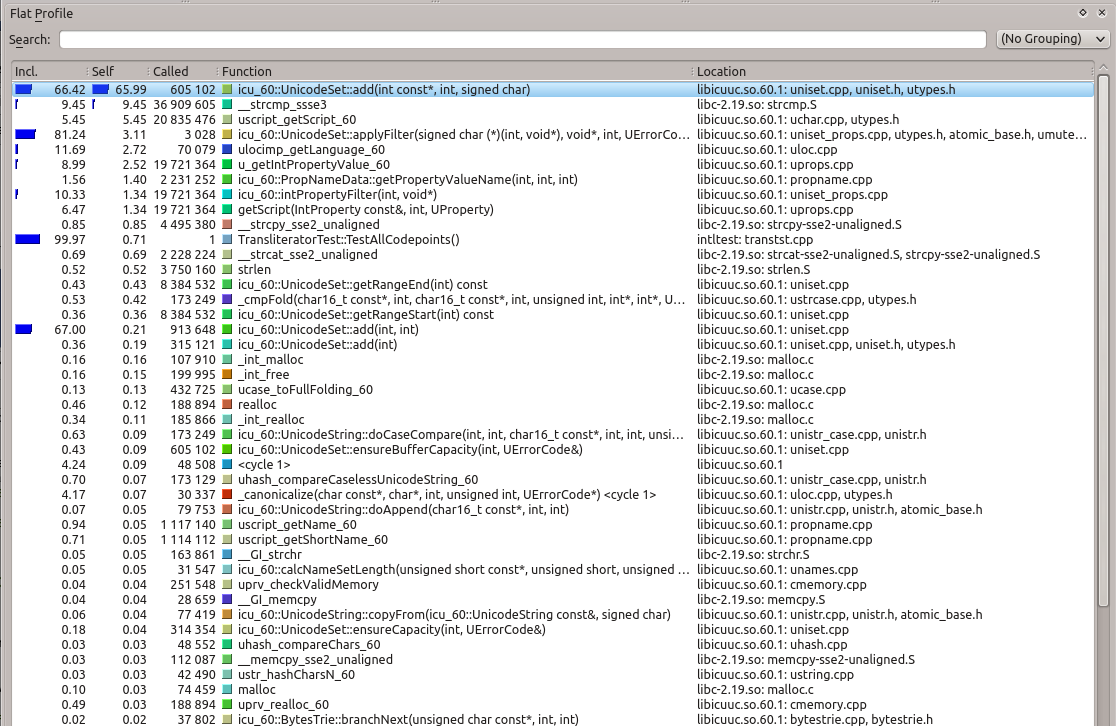
Time spent in each function, self time only. UnicodeSet::add() is hot.
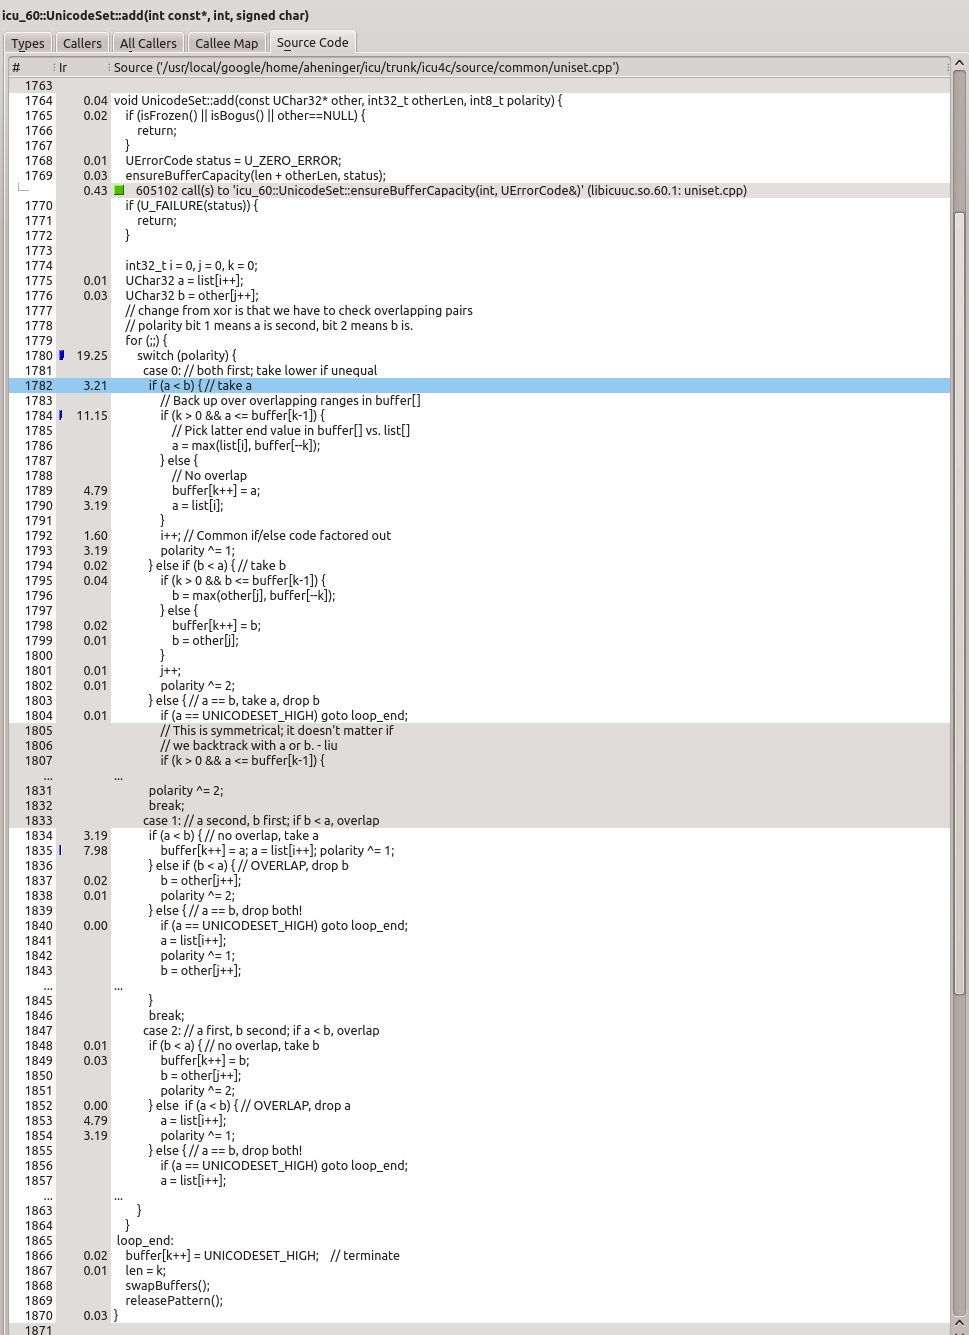
Annotated source for UnicodeSet::add()